
State of the Market: Multifamily Housing
As we enter Q4 of 2025, the writing on the wall is now unmistakable: institutional capital is back in Portland, buying at compressed cap rates and betting on scarcity.
At Seneca, we don’t react to narratives — we dissect the data and underwrite realities. Every decision starts with questions:
What spread to Treasuries are institutions underwriting today, and how does that compare to prior cycle entry points?
Of the units in the Portland pipeline, how many are truly capitalized versus stalled — and what does that mean for absorption in 2026–2027?
Which capital sources — ODCE funds, insurers, debt funds — are stepping in first, and what assumptions are they embedding about rent growth and expense inflation?
How much pricing power will actually come from renewals versus new leases in a slower macro cycle?
What’s the durability of in-migration to the Pacific Northwest despite negative media narratives, and how much is driven by high-income knowledge workers versus service sectors?
Where is the disconnect between permits and actual starts the most acute, and what does that imply for future absorption pressure?
And ultimately: in 2030, will the most valuable holdings be those newly delivered in supply-constrained cores — whether acquired at today’s compressed cap rates or created through disciplined development?
Our belief is simple:
Disciplined questions drive better decisions. Better decisions drive precise execution. Precise execution builds durable assets. Durable assets drive lasting returns.
That’s how Seneca operates. And as we track the data daily — sales velocity, pipeline delivery, capital inflows, building incentives — the story is becoming clear: the multifamily sector isn’t just recovering, it’s accelerating.
Capital is Coming Back
In Portland alone, multifamily sales stand at $1.1 billion year-to-date (2025). That’s nearly matching 2024’s total of $1.5 billion, and this year’s volume is expected to surpass it.
Q2 2025 sales closed at $450 million — nearly equal to the combined second-quarter totals of 2023 and 2024.
Since 2019, Q4 sales volume has never declined year-over-year. From 2020–2024, Q4 often doubled Q3 levels.
This momentum signals what CoStar analysts call the “next step” in Portland’s capital markets recovery. Higher prices on recent trades show buyers are becoming more aggressive, trying to get ahead of the recovery and secure assets before the housing supply gap widens further.
Demand-side strength is notable: Portland placed in the top tier of U.S. metros for effective rent growth in Q2 2025, alongside Seattle and San Francisco
Who’s Buying?
The buyers aren’t local. 81% of property acquisitions in Portland over the past year were by national firms.
The most active groups include:
FPA Multifamily LLC
MG Properties
Berkshire
All headquartered outside Portland, all with institutional balance sheets behind them.
This inflow of outside capital signals conviction: multifamily remains the first mover in CRE recovery due to its stability and short lease cycles, which allow landlords to capture rent growth quickly during economic accelerations.
The Math Behind Compressed Caps
Historically, cap rates on multifamily averaged a 226 bps spread over the 10-Year UST. Today, that spread is just 93 bps.
Translation? Institutions are willing to accept negative leverage day one—low-5% cap rates against higher borrowing costs—because they’re buying the supply gap, not today’s yield.

JLL Capital Markets - Multi-Housing CMO 2025
The Supply Cliff
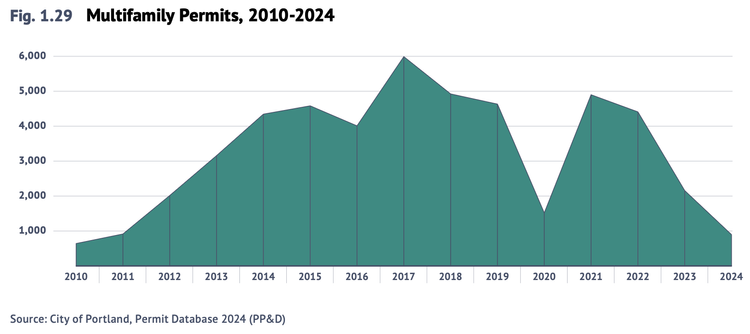
The permit pipeline tells the real story of why scarcity is inevitable in Portland.
Permits peaked in 2017 at 5,990 units as developers rushed to file before inclusionary housing took effect.
Since then, permitting has collapsed, averaging just 3,347 units annually from 2018–2024.
The recent trend is even more dramatic:
2023: 2,150 permits
2024: 896 permits
2025 YTD: only 327 permits
Portland is now on track to record the lowest permit intake in nearly two decades.
When permitting activity dries up, deliveries follow. The supply wave from 2023–2025 will be absorbed, but with so few projects in the pipeline, the back half of the decade will see the lowest level of new deliveries in over 10 years.
And when new supply falls off a cliff, rents accelerate. Forecasts show rent growth strengthening beginning in 2026 and beyond — just as institutional capital and developers alike are fighting for fewer units in a structurally constrained market.
Why This Matters
Institutional investors aren’t buying for today’s yield — they’re buying the future rent curve.
On the surface, many of today’s transactions don’t make sense:
Negative leverage today — financing costs exceed property yields, eroding near-term cash flow.
Thin spreads to Treasuries — the historic 200+ bps premium to the 10-Year UST has compressed to less than 100 bps.
Cap rates in the low-5s for core coastal markets, with little room for error.
And yet, capital is flowing back. Why? Because institutions are underwriting a cycle shift.
They see the short-term supply bulge from 2023–2025 being absorbed, followed by the steepest slowdown in new deliveries in over a decade. With permitting collapsing and construction starts down materially, they know scarcity is building into the system.
The playbook is clear:
Step in now, even if it means taking negative leverage at acquisition.
Capture rent growth over the next 3–5 years as demand collides with undersupply.
Refinance into positive leverage as interest rates stabilize and cash flows expand.
Re-rate assets at exit, as today’s 5.25% cap rate becomes tomorrow’s 6–7% yield on cost, driven by organic rent growth.
This is why capital is willing to compress spreads, even in an uncertain macro environment. When supply can’t keep up with demand, the long-term math works.
Seneca’s Position
At Seneca, we embrace the same long-term fundamentals institutions do, yet our approach is differentiated: we create the assets others are competing to buy. While investors are buying existing assets at compressed cap rates at an average spread of 93 bps, we’re building new supply at a 300+ bps spread in the very markets where demand is strongest and pipelines are drying up.
Over the next several years, Seneca will deliver more than 500 new multifamily units in the Pacific Northwest — in submarkets where the supply shortage is most acute. Each of these units benefits from a 10-year property tax abatement, producing average operating expense savings of ~$2,200 per unit annually (roughly 10–12% of OPEX).
This savings isn’t just incremental cash flow — it commands a higher market valuation, as the net present value of the abatement flows directly into NOI and cap rate pricing. For institutional groups already acquiring at compressed yields, that means stronger risk-adjusted returns and more durable long-term value.
And critically: all of these units will be delivered during what is forecasted to be the lowest delivery period in over a decade. As the temporary 2023–2025 supply wave burns off, rent growth is projected to accelerate beginning in 2026 and beyond.
With land constraints, regulatory hurdles, and rising replacement costs, every project we deliver represents more than just housing — it represents scarcity value, tax-advantaged cash flow, and favorable cycle timing.
That’s the opportunity: while institutional capital is chasing existing assets, we’re creating the next generation of institutional-quality multifamily housing in supply-constrained markets.